BF continues a series of articles based on the full 2019-20 Annual Report with a look at BF membership across the Home Nations
In the run up to the BF AGM on October 10th, we will be publishing a series of articles taken from the full 2019-20 Annual Report (found here). In this article, we look at BF membership:
During the 2019-20 financial year, membership reached a high of 10,886 in November (comparably the highest peak membership in 2017-18 was 10,638)
End of year total individual membership was 10,630, in comparison to the 2018-19 total of 10,717. Club membership ended the year on 436, in comparison to 2018-19 total of 440.
The overall picture of membership for 2019-20 was fairly steady with the start of a decline in March 2020, which we expect to continue in response to the Covid-19 lockdown.
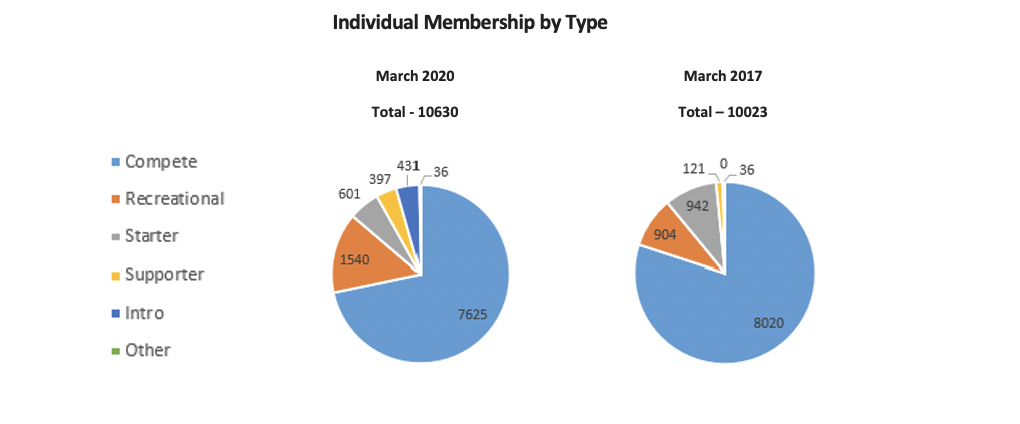
Overall this represented around a 1% decrease in membership. Excluding the Introductory membership which rose year-on-year from 385 to 431, the underlying paid membership total dropped by just over 1% to 10,199.
Analysing the 10199 total in more depth there was an increase in Recreational (138/10%) and Supporter membership (154/33%), but a fall in Starter (45/7%) and Compete (380/5%).
As of 31 March 2020, the auto-renewal rate of all individual memberships was 59% (compared to 62% in March 2019).
After several years of growth, Membership income stabilised at just under £260k (similar to the 2018-19 figures). The majority of this income continues to be taken up in five expense categories – insurance, The Sword, safeguarding, events and standard office/organisation running costs (rates, utilities and so on).
The lack of membership funds to cover staff cost, support athlete development or drive development of and participation in the sport continues to be of significant concern and leaves BF reliant on external funding from Sport England and UK Sport for these activities.
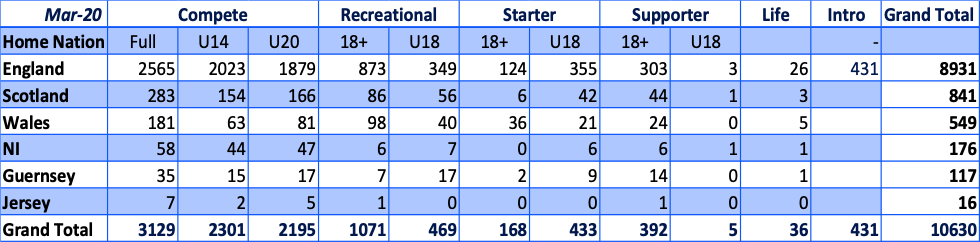
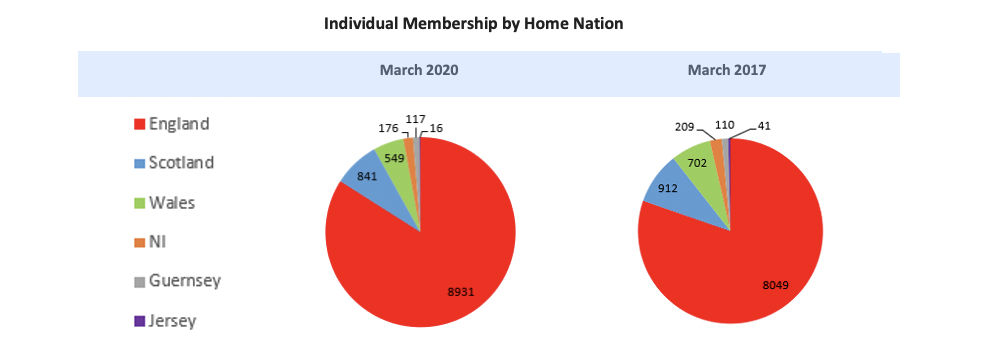
The following charts show the breakdown of individual membership types and membership distribution across the Home Nations. As year on year movement is gradual, 2017’s figures are shown for comparative purposes.
The full 2019-20 Annual Report along with the accompanying accounts can be found here.

Sign up to receive regular highlights from the exciting world of fencing - celebrating the best of our unique and inspiring community